Mapbox GL is a suite of open-source libraries for embedding customizable and responsive client-side maps in web, mobile, and desktop applications. Mapbox GL maps render at a high frame rate. The abbreviation “GL” comes from OpenGL, the industry-standard Open Graphics Library. Mapbox GL allows you to use custom styles designed in Mapbox Studio. You can also manipulate every aspect of …
D3.js and Basics
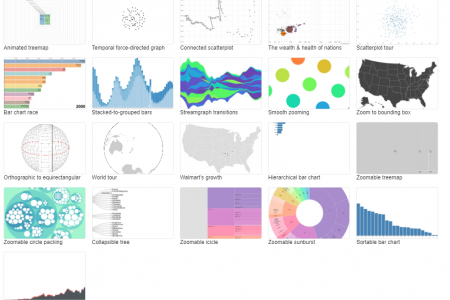
D3.js is a JavaScript library for producing dynamic, interactive data visualizations in web browsers. It makes use of Scalable Vector Graphics, HTML5, and Cascading Style Sheets standards. It is the successor to the earlier Protovis framework. D3 was designed for more than just graphs and charts. It’s also capable of presenting maps, networks, and ordered …
Grafana – Beautiful Dashboard / Data visualization made easy
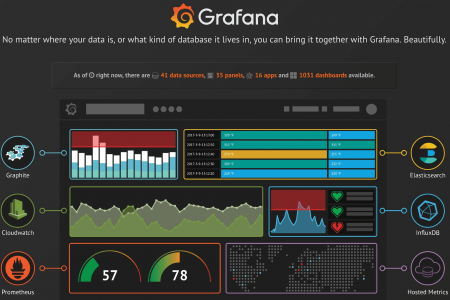
Grafana allows you to query, visualize, alert on and understand your metrics no matter where they are stored. Create, explore, and share dashboards with your team and foster a data driven culture: Visualize: Fast and flexible client side graphs with a multitude of options. Panel plugins for many different way to visualize metrics and logs. Dynamic …
Grafana
Grafana is an open source metric analytics & visualization suite. It is most commonly used for visualizing time series data for infrastructure and application analytics but many use it in other domains including industrial sensors, home automation, weather, and process control. Here is detailed documentation about the functionalities of grafana.