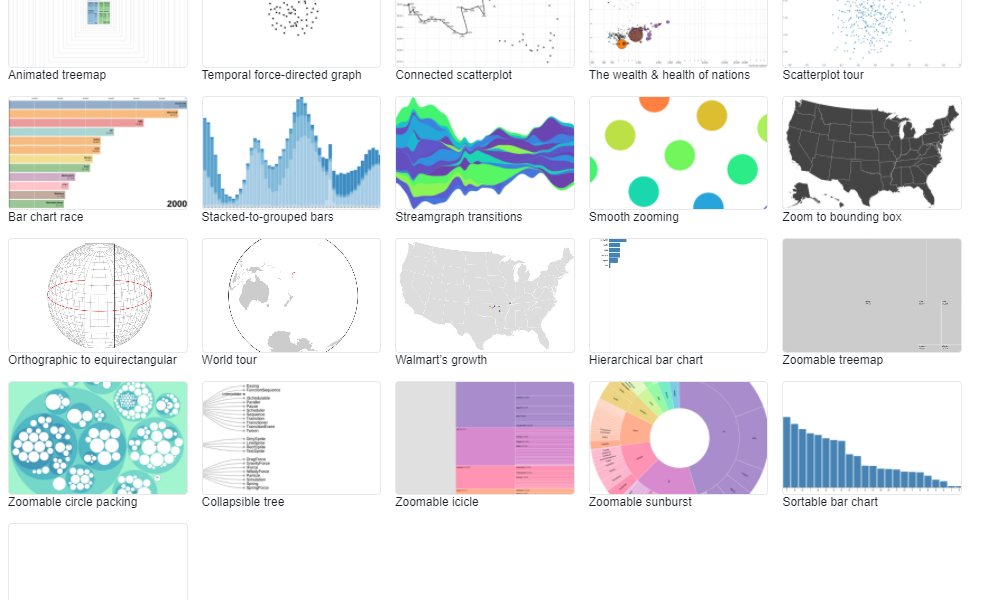
D3.js is a JavaScript library for producing dynamic, interactive data visualizations in web browsers. It makes use of Scalable Vector Graphics, HTML5, and Cascading Style Sheets standards. It is the successor to the earlier Protovis framework.
D3 was designed for more than just graphs and charts. It’s also capable of presenting maps, networks, and ordered lists. It was created for the efficient manipulation of documents based on data.
Select, Append, and Chained Operators
D3 has a select() method for grabbing DOM elements. Once selected, you can apply operators to these elements. This method selects the first element of that type.
Operators can then be used to get or set items such as attributes, properties, styles, text, and html.
D3 methods can be chained with a syntax much like jQuery.
Each operator in the chain returns a selection and the next operator in the chain operates on that selection.
Notice that order matters, the last item is on top.
Binding Data to the SVG
D3 can load data from a number of types of external resources. These include CSV, TSV, JSON, and XML. We just need to ultimately construct an array from the data. For now we’ll use an array of JSON objects.
There are several methods required for for binding data points to our graph (I’ve chosen to represent the data with circles):
selectAll('circle') – selects all circles in our SVG and returns an empty array if there aren’t any yet.
data(dataArray) – this joins an array of data to the current selection.
enter() – joins the data to placeholders for the circles.
append('circle') – appends the circles to the SVG.
Mike Bostock has a pretty good explanation of this in his article: Thinking with Joins.
Note that when we use a data array, we need to reference the data from an anonymous function.
Scaling our Data
We need to scale our data to fit the space available. D3 provides functions to help us do this. There are different scale types available, but for this example we’ll use a linear scale, d3.scale.linear(). We need to specify a domain and range. The domain refers to the data and the range refers to the SVG space.
The origin of the SVG is in the upper left corner, but our graph origin will be in the lower left corner.
Make Data Scaling More Dynamic
So far we’ve hard-coded our domain, but it would be better to have D3 help us determine our domain by calculating the max and min for our data using the d3.max() and d3.min() methods.
Greate article. Keep writing such kind of information on your page. Grissel Kristofer Gayle
I loved as much as you will receive carried out right here. The sketch is tasteful, your authored material stylish. nonetheless, you command get bought an nervousness over that you wish be delivering the following. unwell unquestionably come more formerly again since exactly the same nearly very often inside case you shield this hike. Kaile Dimitri Fagan
Love you auntie!! Enjoy that beach life and time with sisters! Annabell Irwinn Fielding
Aute mi ut suspendisse velit leo, vel risus ac. Amet dui dignissim fermentum malesuada auctor volutpat, vestibulum ipsum nulla. Ariel Huey Scoter