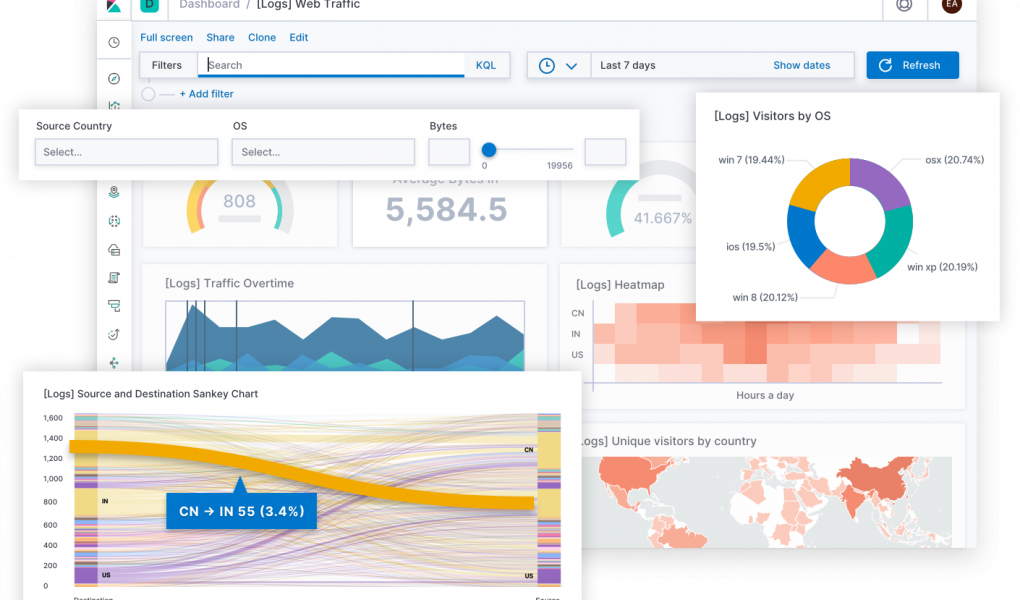
Kibana is a free and open user interface that lets you visualize your Elasticsearch data and navigate the Elastic Stack. Do anything from tracking query load to understanding the way requests flow through your apps.
Build visualizations simply and intuitively
Start exploring even if you’re not sure where you’re headed. Drag and drop fields, and see immediate previews as your data takes shape. Would that look better as a bar chart? Based on your field selection, smart suggestions in Kibana Lens guide you towards visualizations that most effectively communicate your data. Spot an interesting trend that spurs another idea? No problem. Switch data sources on the fly for ad hoc analysis that makes it simple to follow your instincts and build out dashboards to continue monitoring. And it’s free and open.
Get creative with Canvas in Kibana
Go beyond the grid. Infuse your brand and style into the story of your data with the logos, colors, and design elements that are unique to you. Canvas is a free and open feature of Kibana where you can get creative with your live data — and it supports SQL.
Bring everyone in on the Kibana goodness.
Easily share Kibana visualizations with your team members, your boss, their boss, your customers, compliance managers, contractors — anyone you like, really — using the sharing option that works for you. Embed a dashboard, share a link, or export to PDF, PNG, or CSV files and send as an attachment.
Beautifully secure
Organize your dashboards and visualizations using Kibana Spaces. Use role-based access control to invite users into certain spaces (and not others), giving them access to specific content and features.
Build alerts that trigger custom actions
Keep critical changes on your radar to avoid crisis scenarios. Create alerts that use index- and metric-based thresholds to send emails, create Slack notifications, activate PagerDuty workflows, or kick off custom integrations using webhooks. Define unique alerts from within specific apps like SIEM, APM, Uptime, or Metrics and monitor them holistically in the Management tab.


